Subjects were scored along three different dimensions:
1. Synchrony
We measured how well each student could synchronize with a driving beat in a group setting.
Setting
With the exception of the presence of recording hardware and the fact that they were separated into smaller groups (8-12 as opposed to 20-25), the setting was very much like that of an ordinary class.
Each instrument was rigged with piezoelectric sensors in such a way that its audio signal was completely isolated, allowing for very accurate recording and measurement of sound onsets (aka “attacks”), which correspond to subjects striking the keys.
The data reported here corresponds to a condition in which our researcher repeatedly plays a single note at a rate of approximately 0.8 Hz. The subjects were instructed to synchronize with this beat. Each of these episodes is 1 minute long and they are repeated 4 times, interleaved with other activities across a 30 minute recording session.
Analysis of Synchrony
In order to measure synchrony we applied the following procedure. Taking our researcher’s playing record as a reference, we calculated the onsets, filtered the data around the frequency of the beat, and calculated the phase as a function of time, a phase of 0 corresponding to each time he hit his instrument, and a phase of pi corresponding to the off-beat.
Once this was established we calculated the phase of each of the beats of our subjects. In order to parameterize how well they synchronized we calculated the vector strength (VS).
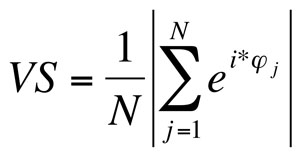
Where, N is the total number of strikes, j is the strike number and  is the phase. Thus defined, VS is 1 if the student plays always with the same delay with respect to the driving beat and 0 if the student plays randomly. For each episode we ranked the subjects’ VS, from most to least synchronized. Then we took the average of these rankings across the 4 episodes.
We took the approach of ranking subjects within their playing groups, as opposed to ranking them by raw VS, because individual performance seemed to be very strongly modulated by that of the group. Subjects in groups that featured several poor synchronizers tended to have more difficulty maintaining synchrony. Thus, ranking subjects across groups based solely on VS would not have yielded accurate results.
2. Psychometric Tasks
Below, we present the results of the Ericksen Flanker Task. Subjects are asked to press a key with their left or right index finger when an arrow (target) appearing in the middle of the screen points in the corresponding direction. 100 ms before the target, two flanking arrows appear that point either in the same (congruent condition) or opposite (incongruent condition) direction as the target, the subject is instructed to ignore these flanking arrows.
The data we show corresponds to the accuracy in the congruent condition. Because we took data from subjects with a wide age range, we scored the results according to their grade, with a value of 1 corresponding to the most accurate subject.
3. Swan Questionnaire
The Swan Questionnaire is often used in order to assess attentional issues in children. In this study, we asked the “home room” teachers to fill out a Swan Questionnaire for each subject. Below, we present the results from the Swan questionnaire filled out by the teachers. Subjects were ranked within each grade. In this way, rankings were normalized for differences in general biases or assessments each teacher might present in their scorings.